
Culture (organizational or otherwise) can most simply be understood as “how we do things around here.”
There are a million “things” that make up an organization’s culture: things like meeting norms; how we talk to each other (in person, online); what it means when someone says “the deadline for this project is November 6th;” how inclusive we are.
To imagine this visually, imagine an N-dimensional chart with each element of culture on one axis.

And now, to keep things simpler, let’s collapse that N-dimensional chart into two dimensions – because otherwise all of this will be too hard to visualize.

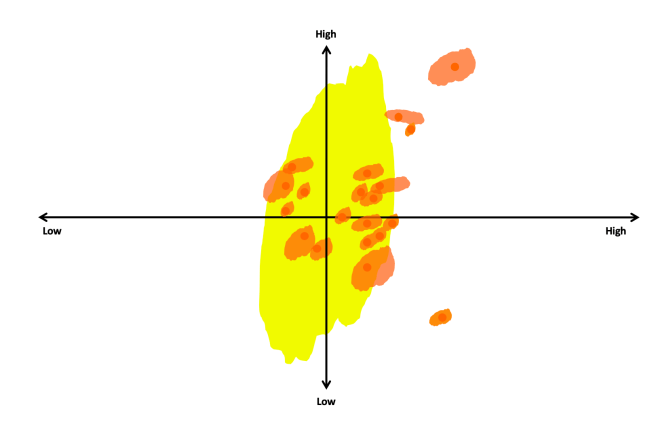
Envision an organization’s culture represented on this graph. To explore what we mean here, let’s imagine two organizations.
Organization 1 has a loosely defined culture: we represent that with the broad shape on the graph, and the light color to show ‘low intensity.’ In organization 1, a wide spread of behaviors “works” because the culture is not strongly defined.

Conversely, in organization 2, the shape of the “culture graph” is much tighter and the culture is much stronger (darker color).

In organization 1, nearly anyone can “fit in” because anything goes in that organization. In organization 2, with a stronger culture, only a certain set of people will feel comfortable there, but, for those people, the culture will have a stronger pull that will keep them motivated and make them more productive.

Now, moving beyond thinking about the impact of the culture on the employees, let’s think about the impact of the employees on the culture.
Here’s where things get interesting, because culture is not static: each team member has their own influence on the culture, either pushing against (weakening) the existing culture or strengthening it.
Let’s visualize this as the cultural “force field” that each team member brings to our organization, each and every day. Like our two organizations, each person has a different cultural force field that they exert on those around them: it has a size, a shape, and an intensity…all of which affect how that person impacts the organization’s culture over time.
(I understand that the visuals might be breaking down a bit…stay with me here. The point is: the shape and intensity of your ‘culture graph’ today and tomorrow are a function of all the behaviors of your team between now and tomorrow: how people act, what behaviors are rewarded and punished, what people say, what they do…)
With this backdrop, we can ask a few questions about our organizational cultures, things like:
- What is the shape and intensity of our own ‘culture graph’?
- How does it differ by location, function, and seniority? Are these differences intentional?
- When we think of the future, what do we imagine happening to our culture graph? Does today’s culture remain in place? Does it morph? Intensify so we stay true to ‘who we are’? Weaken so we can accommodate more people?
- What do we do about people who supercharge our culture, who will serve as ballasts between today and the future?
- And what do we do about people who perform well but who push against our current and future culture?
- Most important: if you asked your team whether their job is to create and accentuate your culture, or to accept and adapt to it, what would they say?
- What would you like them to say?
I share all this not to offer answers to the above questions, but in an effort to make the invisible visible.
Our culture either accentuates and accelerates everything we do, or it stands in the way, gumming up the works. Yet, despite these powerful multiplier effects, we often act as if culture will take care of itself.
Perhaps, then, it is time to bring it out in the open.
Perhaps it is time to invite ourselves and teams to see and own our active role in defining, strengthening and reinforcing “how we do things around here.”
5 thoughts on “Culture Graphs”